

Brand new info for me
And very disturbing

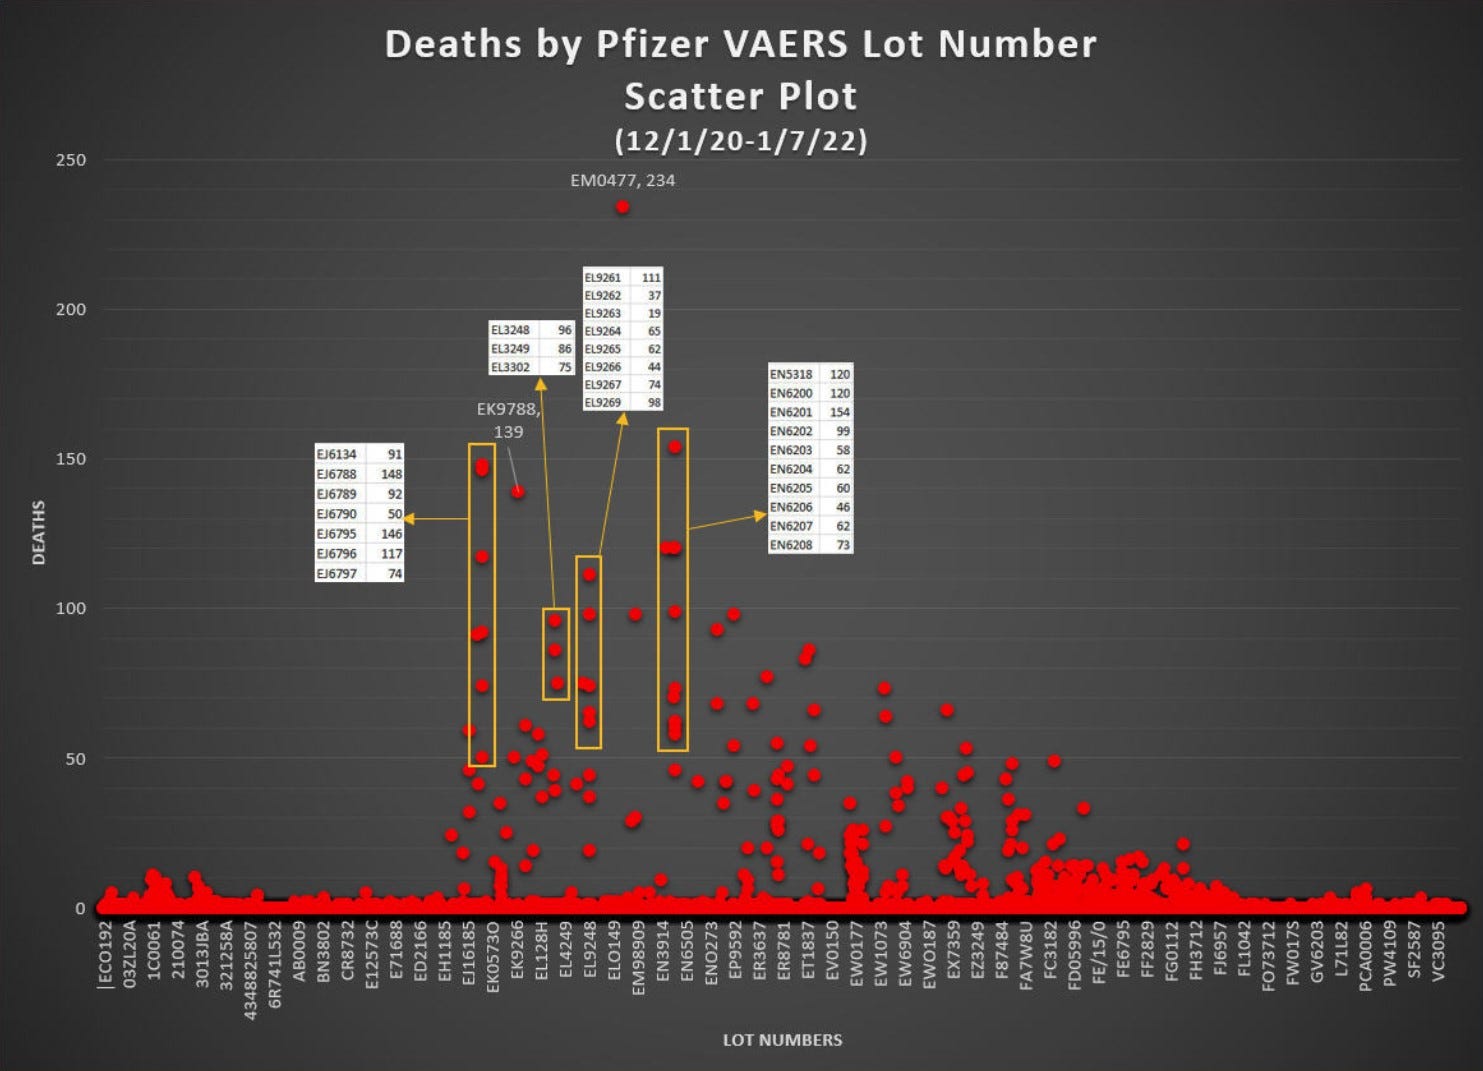
I’ve been visiting the VAERS Analysis website frequently to see the summaries of VAERS data they create, and I’ve included content from it at least a couple times here already, but this is the first I’ve seen info on bad lots of the “vaccines”. It turns out that there’s a guy who’s compiling adverse events versus “vaccine” lot numbers, and there are some very clear patterns.
If his info on the range of quantities per each lot are correct, this is very disturbing indeed. If it turns out that the lots with the highest deaths and other adverse events actually were much larger than the maximum he posits, as in far more people were jabbed for those lot numbers, then his data will be less compelling. Here’s a sample, and the link to the page is below:
https://vaersanalysis.info/2022/01/16/hot-lots-update-for-covid-19-jabs-data-through-1-7-22-part-ii/